Power transformers are among the most expensive and important assets in any electrical power system. During transportation, installation, and service, transformers can experience mechanical stress that may not be visible from the outside. Internally, the windings or core may have shifted, deformed, or suffered damage and none of this would show up in a routine visual inspection.
This is exactly where the Sweep Frequency Response Analysis (SFRA) test becomes invaluable. The SFRA test is a non-destructive diagnostic technique that measures the electrical response of transformer windings across a broad frequency range. It helps engineers detect winding deformation, core movement, and other mechanical faults before the transformer is energized. The SFRA full form is Sweep Frequency Response Analysis, and it is also commonly referred to as Frequency Response Analysis (FRA). Both terms describe the same swept sine wave testing method used across the power transformer industry worldwide.
In this technical guide, we will discuss everything you need to know about the SFRA test of transformer, including its working principle, test procedure, connections, SFRA graph analysis, fault detection, result interpretation, and relevant industry standards such as IEEE C57.149 and IEC 60076-18. Practical examples are included throughout to help you apply these concepts in real-world field scenarios confidently.
1. What Is Sweep Frequency Response Analysis (SFRA)?
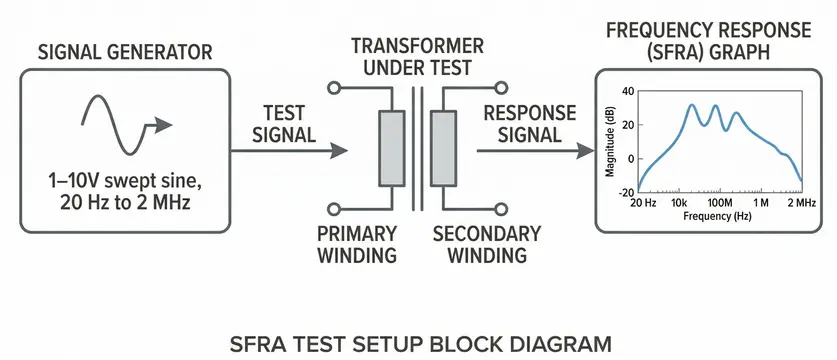
Sweep Frequency Response Analysis is a diagnostic testing technique used to evaluate the mechanical and structural integrity of a transformer’s internal components. The test injects a low-voltage swept sine wave signal into a transformer winding and measures the resulting voltage response across a wide frequency spectrum ranging from 20 Hz to 2 MHz.
The output of the test is a frequency response curve, also called the FRA signature or FRA fingerprint of the transformer. This curve is a graphical representation of how the transformer responds to signals at different frequencies. The vertical axis shows the response magnitude in decibels (dB), and the horizontal axis shows the frequency in Hz or kHz.
The FRA test of transformer works on a straightforward electrical principle. Every transformer winding behaves like a distributed RLC network, a combination of Resistance (R), Inductance (L), and Capacitance (C). These electrical parameters are directly determined by the physical geometry of the winding, the core structure, and the insulation arrangement.
If any physical change occurs inside the transformer such as a winding displacement or a core shift, the RLC values of that network change. This change produces a measurable shift in the frequency response curve. By comparing a newly measured FRA signature with a factory reference signature, engineers can determine whether the transformer has maintained its mechanical integrity.
A simple way to understand this: imagine pressing a fingerprint twice. If the finger is undamaged, both prints will match perfectly. If the finger has a cut or deformation, the second print will look different. The SFRA test works the same way for transformer windings.
2. FRA vs SFRA: What Is the Difference?
Many engineers use the terms FRA and SFRA interchangeably, but there is a technical distinction worth knowing.
FRA (Frequency Response Analysis) is the broader term that covers any method of measuring a transformer’s frequency response. There are two main methods under this umbrella:
- SFRA (Sweep Frequency Response Analysis): uses a swept sine wave signal that steps through each frequency one at a time across the spectrum. This is the most widely used method in modern transformer SFRA testing.
- IFRA (Impulse Frequency Response Analysis): uses a voltage impulse signal and applies Fast Fourier Transform (FFT) mathematics to derive the frequency response.
In the power transformer industry today, SFRA is the preferred and dominant method because it offers better signal-to-noise ratio and more accurate measurements at individual frequencies. All references to FRA test of transformer in modern standards such as IEEE C57.149 and IEC 60076-18 primarily address the swept sine wave approach.
3. Why Is the SFRA Test Important for Transformers?
The purpose of SFRA test in transformer diagnostics is to provide an objective and quantitative assessment of the transformer’s internal mechanical condition. Here are the main reasons this test is performed.
3.1 Detection of Transportation Damage
Large power transformers are transported by rail, ship, or road sometimes over thousands of miles. During transit, road vibrations, sudden braking, or accidental impacts can cause internal mechanical damage. This damage may include winding displacement, core movement, or loosening of clamping structures.
A transformer can look perfectly normal from the outside while having significant internal damage. The SFRA test is one of the few diagnostic tools that can reveal this hidden damage without opening or dismantling the transformer.
3.2 Assessment of Winding Integrity
The transformer frequency response analysis test is highly sensitive to changes in winding geometry. It can detect axial or radial winding displacement, hoop buckling, inter-turn faults, and partial winding collapse that develop over time or as a result of through-fault currents.
3.3 Non-Destructive and Non-Intrusive Testing
The SFRA test does not damage the transformer in any way. It uses a low-voltage signal of approximately 1 to 10V RMS far too low to cause any electrical or thermal stress. The transformer does not need to be dismantled or internally accessed. This makes it completely safe for in-service and newly installed units.
3.4 Factory Baseline for Condition Monitoring
The FRA signature recorded at the factory immediately after manufacturing serves as the reference baseline for all future testing. Every time the transformer is tested in the field, the new signature is compared against this factory data. This allows engineers to track any changes in the transformer’s condition over its entire service life.
3.5 Compliance With Industry Standards
The SFRA test is governed by two major international standards: IEC 60076-18 and IEEE C57.149 (ANSI/IEEE C57.149). These standards define the test procedure, equipment requirements, measurement configurations, and interpretation methods. Following these standards ensures that results are consistent, repeatable, and comparable between different testing organizations.
4. SFRA Test Equipment
Before looking at the SFRA test procedure, it is important to understand the equipment involved. Here is a breakdown of the essential items needed to perform a transformer SFRA test.
4.1 SFRA Test Kit (SFRA Tester)
The SFRA test kit also called an SFRA tester or sweep frequency response analyzer is the primary instrument used for this test. A good-quality SFRA test set should have the following specifications:
- Signal type: Low-voltage swept sine wave generator
- Output voltage: Typically 1 to 10V RMS
- Frequency range: 20 Hz to 2 MHz
- ADC resolution: Minimum 12-bit
- FFT resolution: Minimum 1024 data points, with modern instruments offering up to 1 million (1M) data points for high-resolution frequency analysis
- Measurement channels: At least two — one for the source signal and one for the response signal
- Built-in software: For data capture, FRA signature display, baseline comparison, and report generation
Modern SFRA kits from manufacturers like Megger, Omicron, and Doble Engineering provide automated sweep capability, real-time display, and built-in statistical comparison tools.
4.2 Coaxial Measurement Cables
The test cables used in SFRA testing must be coaxial cables the same type used in RF (radio frequency) applications. Standard test leads introduce too much inductance and capacitance at high frequencies, which distorts the measurement. Coaxial cables maintain signal integrity across the full frequency range of the test.
Cable management is also extremely important. The cables must be kept physically separated from each other during testing. Cables that are bundled together or run parallel for long distances will couple electromagnetically and alter the measured response.
4.3 Grounding Equipment
The transformer tank must be properly grounded before testing. All grounds must be referenced to a single common point to avoid ground loops. The shield of the coaxial measurement cable should be grounded only at the instrument end, not at both ends. Grounding at both ends creates a ground loop that introduces noise and distorts the high-frequency measurements.
4.4 Computer With Analysis Software
Most modern SFRA test kits come with dedicated software for PC or laptop. The software handles data storage, FRA signature overlaying, statistical analysis, and report generation. Some kits also include automated comparison algorithms that calculate statistical indices per IEC 60076-18 criteria.
4.5 Factory Test Reports (Baseline Data)
This is not a piece of hardware, but it is just as important as the test instrument. The factory FRA test report must be obtained in digital format from the transformer manufacturer before the field test begins. The factory baseline is the reference against which all field measurements are compared. Without it, the SFRA test result analysis is limited to comparing between phases or between identical transformer units which is less reliable than factory-to-field comparison.
5. SFRA Test Procedure for Transformer: Step-by-Step
The following is a detailed SFRA test procedure that follows the requirements of IEC 60076-18 and IEEE C57.149. Field engineers should treat each step seriously because small errors in setup can produce misleading results.
5.1 Step 1: Pre-Test Preparation
Start by gathering all necessary documentation and verifying the transformer’s condition before connecting any test equipment.
5.1.1 Documentation Checklist
- Factory FRA test report (in digital format)
- Impact recorder report from transportation monitoring
- Transformer nameplate data and winding configuration diagram
- Tap changer schedule showing exact tap position numbers
- Previous field SFRA records (if this is a repeat test)
5.1.2 Physical Preparation
The transformer must be completely de-energized and isolated from all external electrical connections. All safety procedures must be followed, and the transformer must be properly grounded before any personnel or test equipment approach the terminals.
Allow the transformer to stabilize at ambient temperature before beginning. Temperature affects the resistance of the windings, which influences the low-frequency portion of the FRA signature. If there is a large temperature difference between the factory test conditions and the field test conditions, this must be noted in the test report. Ideally, results should be compared at similar temperatures to avoid misinterpreting a temperature-related shift as a mechanical fault.
The transformer must also have oil filling completed and the oil level should match the condition during factory testing as closely as possible. Differences in oil level or oil quality can influence the dielectric characteristics of the insulation system and affect the high-frequency region of the FRA response.
Finally, core demagnetization before testing is recommended. Residual flux influences the low-frequency response and can cause variation between measurements. Demagnetizing the core before each test improves repeatability.
5.2 Step 2: Record Exact Tap Changer Position
This step is one of the most frequently overlooked in practice. The tap changer position must be recorded as the exact tap number not just “highest” or “lowest.” Even a one-tap difference in the tap changer position between the factory test and the field test can produce measurable changes in the FRA signature that may be misidentified as mechanical damage.
Before connecting the test kit, check and record the tap position number precisely. The SFRA test must then be repeated at three tap positions:
- Maximum tap position (highest voltage tap)
- Nominal tap position (rated voltage tap)
- Minimum tap position (lowest voltage tap)
Testing at all three positions gives a complete picture of the winding response across the full range of the tap changer operation.
5.3 Step 3: SFRA Test Connections
The SFRA test connections depend on the type of transformer being tested. IEEE C57.149 and IEC 60076-18 define three standard measurement configurations:
Configuration 1 — End-to-End Open Circuit: The signal is injected at one end of the winding and measured at the other end. All other windings are left floating (electrically disconnected). This is the most common configuration and captures the overall winding response.
Configuration 2 — End-to-End Short Circuit: One winding of the transformer is short-circuited while the measurement is made on another winding. This configuration emphasizes the leakage inductance of the transformer and is useful for detecting inter-winding faults.
Configuration 3 — Capacitive Inter-Winding Measurement: The signal is injected on one winding and the response is measured on a different winding through the inter-winding capacitance. This configuration is sensitive to changes in the insulation geometry between windings.
The table below summarizes the standard SFRA test connections for different transformer types.
5.3.1 SFRA Test Connections for Two-Winding Power Transformers
For a standard two-winding power transformer (such as a 132/33 kV grid transformer), the following measurement sets are performed using the end-to-end open circuit configuration:
High Voltage (HV) Winding Tests:
- H1 to H2 (H3 and all LV terminals floating)
- H2 to H3 (H1 and all LV terminals floating)
- H1 to H3 (H2 and all LV terminals floating)
Low Voltage (LV) Winding Tests:
- X1 to X2 (X3 and all HV terminals floating)
- X2 to X3 (X1 and all HV terminals floating)
- X1 to X3 (X2 and all HV terminals floating)
The results from the three phases should be overlaid and compared with each other and with the factory baseline.
5.3.2 SFRA Test Connections for Auto-Transformers
Auto-transformers require a more extensive set of test connections due to their series-common winding structure. The following combinations are typically performed:
Series Winding Tests:
- H1 to X1 (all other terminals floating)
- H2 to X2 (all other terminals floating)
- H3 to X3 (all other terminals floating)
Common Winding Tests:
- X1 to H0X0 (all other terminals floating)
- X2 to H0X0 (all other terminals floating)
- X3 to H0X0 (all other terminals floating)
Tertiary Winding Tests (if applicable):
- Y1 to Y2 (all other terminals floating)
- Y2 to Y3 (all other terminals floating)
- Y1 to Y3 (all other terminals floating)
Short Circuit Measurement Sets: Various combinations between H, X, and Y windings as specified by the test engineer or per the manufacturer’s recommendations, using the end-to-end short circuit configuration.
Here, H refers to the high-voltage terminal, X refers to the common terminal, and Y refers to the tertiary winding terminal. H0X0 is the neutral terminal common to both the H and X windings. These are standard ANSI/IEEE terminal designations for auto-transformers as defined in ANSI C57.12.70.
5.3.4 SFRA Test Connections for Shunt Reactors
For single-phase or three-phase shunt reactors, the test connections are:
- H1 to H0
- H2 to H0
- H3 to H0
Where H0 is the neutral terminal of the reactor.
5.4 Step 4: Signal Injection and Data Acquisition
Once the connections are verified and documented, the SFRA test kit can begin the measurement sweep. Set the instrument to perform a frequency sweep from 20 Hz to 2 MHz. The instrument automatically injects the swept sine wave signal at each frequency step and measures the response.
The measured output is the voltage transfer function (the ratio of the output voltage to the input voltage) expressed in decibels (dB). A 0 dB reading means the output is equal to the input. A negative dB value means the output is attenuated. Most FRA signatures show attenuation at higher frequencies.
The instrument captures and stores the complete frequency response curve. Modern instruments with 1M FFT data points provide very fine frequency resolution, which makes it easier to detect narrow resonance peaks and valleys that may shift due to mechanical changes.
During the measurement, ensure the following:
- No personnel are touching the transformer or test cables
- No other high-voltage equipment is being operated nearby (electromagnetic interference distorts results)
- The cable routing is identical to the configuration used in all previous tests
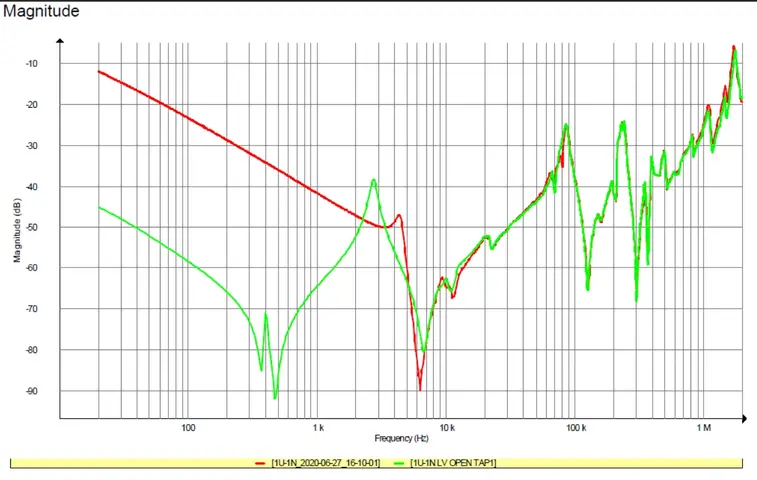
5.5 Step 5: Baseline Comparison and Overlay
After the measurement is complete, load the factory FRA baseline into the analysis software. Overlay the new field measurement on the same graph as the factory signature.
A healthy transformer will show very close agreement between the two traces. The resonance peaks and valleys should appear at the same frequencies and at similar magnitudes.
This overlay comparison is the core of SFRA graph analysis. Engineers visually examine the two traces and look for any shifts, missing peaks, additional resonances, or changes in attenuation level.
6. SFRA Graph Analysis and Result Interpretation
SFRA test result analysis is the most intellectually demanding part of the entire testing process. It requires experience, knowledge of the transformer design, and a systematic approach. Below is a structured method for interpreting SFRA transformer test results.
6.1 SFRA Frequency Regions
The FRA signature is divided into three frequency regions. Each region is dominated by different electrical parameters and is therefore sensitive to different types of physical faults. These regions are defined by IEEE C57.149 and IEC 60076-18.
6.1.1 Low-Frequency Region: 20 Hz to 2 kHz
This region is dominated by the core and bulk magnetizing inductance of the transformer. Changes in this region indicate problems with the magnetic core structure. Faults that show up here include:
- Core movement or core displacement
- Shorted laminations in the core
- Open-circuit conditions in the windings
- Loose core clamping structures
It is important to note that residual flux (residual magnetism) in the core can also influence measurements in this region. Residual magnetism is not a fault it is a test condition variable that must be controlled. Core demagnetization before testing helps ensure repeatability of measurements in this frequency band.
6.1.2 Mid-Frequency Region: 2 kHz to ~500 kHz
This region is the most sensitive band for detecting winding mechanical faults. It is governed by the interaction of leakage inductance and inter-winding capacitance. The resonant peaks and valleys that appear in this region are directly linked to the physical geometry of the windings.
Faults detected in this region include:
- Axial or radial winding displacement
- Hoop buckling of winding conductors
- Bulk winding deformation
- Broken or loose clamping structures
A shift in resonance frequency in this band even a small one is a strong indicator of mechanical deformation. For example, if a winding on a 132 kV power transformer experiences axial displacement during an earthquake, the resonant peaks in the 10 kHz to 200 kHz range will shift when compared to the factory baseline.
Note: The upper boundary of the mid-frequency region varies between references. Some sources place it at 200 kHz, while IEEE C57.149 extends it closer to 500 kHz. The exact boundary depends on the transformer design, and engineers should use their judgment based on the specific transformer under test.
6.1.3 High-Frequency Region: ~500 kHz to 2 MHz
This region reveals the fine structural details of winding construction. It is sensitive to:
- Turn-to-turn short circuits
- Inter-disc faults in disc-type windings
- Localized conductor displacement
- Changes in conductor spacing and insulation geometry
Faults in this region tend to be localized rather than bulk deformations. The high-frequency response is also more susceptible to interference from cable routing variations and external electromagnetic noise, so careful cable management is necessary for reliable interpretation.
6.2 Statistical Interpretation Using Correlation Coefficients
Visual comparison alone is not always sufficient for a definitive assessment. IEC 60076-18 introduces statistical indices to quantify the degree of agreement between two FRA signatures. The primary index used is the Correlation Coefficient (CC).
The Correlation Coefficient ranges from 0 to 1.0:
- CC close to 1.0: The two signatures agree very well. The transformer has maintained its mechanical integrity.
- CC between 0.9 and 1.0: Good agreement with minor differences. Acceptable for most cases, but the specific frequency band showing deviation should be investigated.
- CC below 0.9: Noticeable deviation exists. A detailed investigation is recommended before commissioning.
- CC significantly below 0.9: Serious mechanical changes are indicated. Internal inspection should be considered.
It is important to note that the Correlation Coefficient is calculated separately for each frequency region low, mid, and high rather than across the entire frequency range. This provides more specific diagnostic information about which part of the transformer is affected.
The simple percentage deviation thresholds (5%, 10%) that are sometimes mentioned in older literature are not aligned with current standards. Engineers should rely on the statistical methods defined in IEC 60076-18 Annex C and IEEE C57.149 for standardized and defensible interpretation.
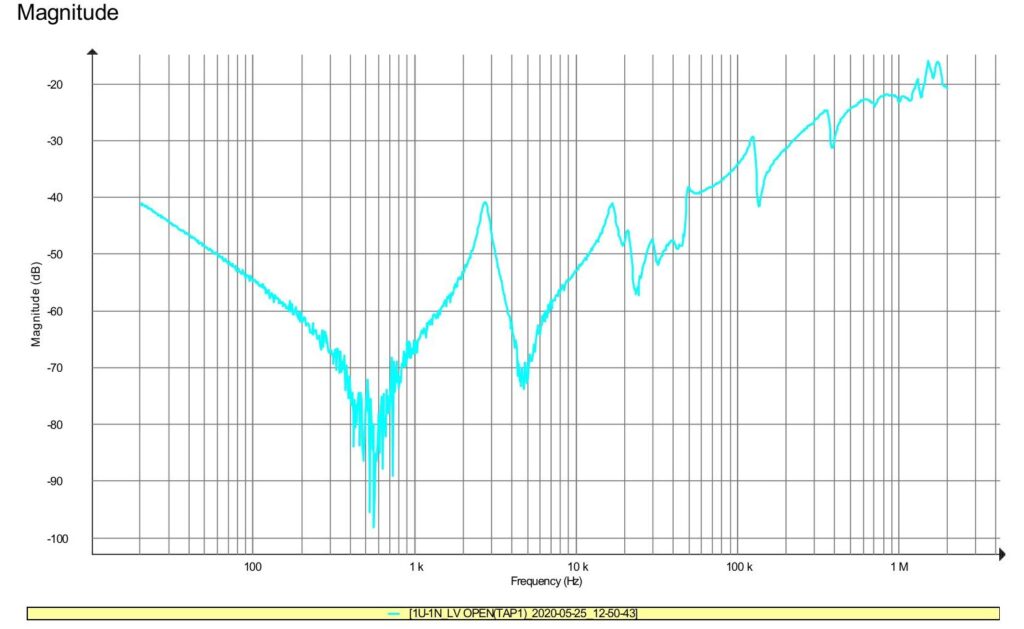
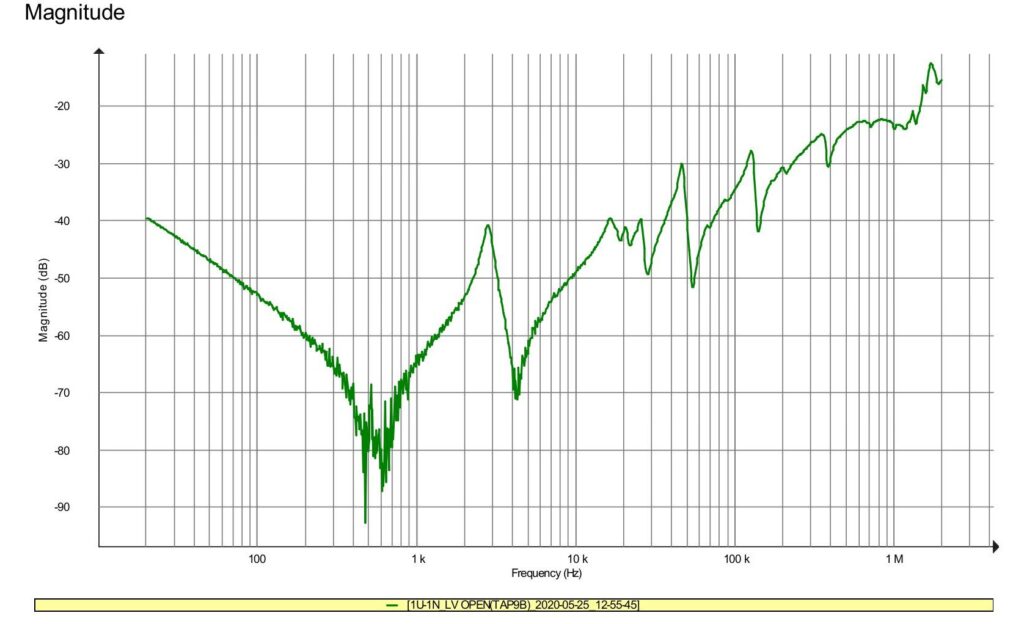
6.3 SFRA Test Result Signature
Here are some SFRA Test signature samples for R Phase (HV to N) with three tap positions lowest, nominal and highest from a actual field test carried out in 2021.

6.4 SFRA Factory vs Field Test Result Signature
7. Common Faults Detected by SFRA Test
The table below summarizes the common faults that SFRA transformer testing can detect, along with the frequency region where each fault is most visible and the expected FRA signature behavior.
| Fault Type | Frequency Region Most Affected | FRA Signature Behavior |
|---|---|---|
| Core Movement / Displacement | Low (20 Hz – 2 kHz) | Shift in low-frequency resonance; change in magnetizing inductance response |
| Shorted Core Laminations | Low (20 Hz – 2 kHz) | Reduced impedance in the low-frequency band |
| Winding Axial Displacement | Mid (2 kHz – 500 kHz) | Shift in resonance peaks and valleys across the mid-frequency band |
| Radial Winding Deformation | Mid (2 kHz – 500 kHz) | Change in resonance frequencies; amplitude deviation in mid-band |
| Hoop Buckling | Mid (2 kHz – 500 kHz) | Significant deviation in mid-frequency trace shape |
| Broken Clamping Structures | Low-to-Mid | Gradual shift across low and mid-frequency regions |
| Partial Winding Collapse | Mid (2 kHz – 500 kHz) | Sharp deviations and distortions in mid-frequency response |
| Turn-to-Turn Short Circuits | High (500 kHz – 2 MHz) | Reduced impedance; loss of fine resonance features in high-frequency band |
| Inter-Disc Faults | High (500 kHz – 2 MHz) | Changes in high-frequency resonance pattern |
| Open Winding Condition | Low (20 Hz – 2 kHz) | Extremely high impedance values across the low-frequency band |
| Loose Tap Changer Connections | Mid-to-High | Irregular deviations in mid-to-high frequency regions |
8. Correlation With Impact Recorder Data
Most large power transformers are equipped with an impact recorder (also called a shock recorder) that monitors and logs any mechanical shocks or vibrations experienced during transportation. After the transformer arrives at site, the impact recorder data is downloaded and analyzed.
The SFRA test results should always be reviewed alongside the impact recorder report. This correlation provides a more complete diagnostic picture.
- If the impact recorder shows high G-force events during transportation and the SFRA signature shows deviations from the factory baseline, this combination strongly confirms that transportation damage has occurred. The transformer should not be commissioned without further investigation or manufacturer consultation.
- If the impact recorder shows high-impact events but the SFRA results closely match the factory baseline, it indicates the transformer absorbed the mechanical shock without internal damage. The transformer may be considered mechanically sound.
- If the SFRA shows deviations but the impact recorder shows no significant events, other causes must be investigated such as incorrect assembly at site, hydraulic pressure effects during oil filling, or errors in the test setup itself.
9. When to Perform the SFRA Test on Transformers
The FRA test of transformer should be performed at the following stages of the transformer’s life:
At the factory: The manufacturer performs the first SFRA test before dispatch. This factory signature serves as the permanent reference baseline for the transformer’s entire service life.
After transportation: The field test is performed immediately after the transformer arrives at its installation site. The field signature is compared to the factory baseline to confirm safe arrival.
After installation and assembly: Once the transformer is fully assembled, oil-filled, and before energization, a final pre-commissioning SFRA test confirms the transformer is ready for service.
After a through-fault event: If the transformer experiences a short-circuit current event during service, the SFRA test is performed to check for any winding deformation caused by the electromagnetic forces during the fault.
After an earthquake or physical impact: Any mechanical event that could have disturbed the internal structure should be followed by an SFRA test.
During periodic maintenance: At regular intervals often every 3 to 5 years depending on the transformer’s age, rating, and service environment an SFRA test is performed to track gradual changes in the transformer’s condition.
Before and after major repairs: An SFRA test before a repair establishes the pre-repair condition baseline. A post-repair SFRA test confirms the repair was successful.
10. SFRA Standards and Codes: IEC 60076-18 and IEEE C57.149
Two international standards govern the SFRA test of transformer practice worldwide.
10.1 IEC 60076-18
Published by the International Electrotechnical Commission, IEC 60076-18 is titled “Power Transformers — Part 18: Measurement of Frequency Response.” This standard covers:
- Test configurations and measurement setups
- Equipment requirements and calibration
- Data recording and documentation
- Statistical interpretation methods including the Correlation Coefficient approach
- Reporting guidelines
IEC 60076-18 is the primary reference for transformer SFRA testing in Europe, the Middle East, Asia, and most international projects.
10.2 ANSI/IEEE C57.149
ANSI/IEEE C57.149 is titled “IEEE Guide for the Application and Interpretation of Frequency Response Analysis for Oil-Immersed Transformers.” This standard covers:
- Measurement procedures for sweep frequency response analysis
- Interpretation methods and diagnostic guidelines
- Frequency region definitions
- Guidance on comparing signatures from different test dates and conditions
IEEE C57.149 is the standard reference for SFRA testing in North America and is widely referenced in international projects.
Both standards complement each other, and many field engineers reference both documents when performing and interpreting transformer SFRA test results.
11. Advantages and Limitations of SFRA Testing
11.1 Advantages
The SFRA test has several advantages over other transformer diagnostic methods.
The test is completely non-destructive and non-intrusive. It does not damage the transformer (non-destructive) and does not require any internal access or dismantling (non-intrusive). These are two distinct advantages that make SFRA suitable for routine use throughout the transformer’s service life.
The test is applicable to transformers at any voltage rating from distribution transformers to ultra-high voltage transmission transformers. The low-voltage signal used in the test is entirely independent of the transformer’s rated voltage.
SFRA provides a permanent, objective record of the transformer’s condition. Unlike a visual inspection, which is subjective and depends on the inspector’s experience, the FRA signature is a numerical dataset that can be stored, compared, and shared.
The test is cost-effective compared to internal inspections, which require oil draining, cover removal, and significant downtime. An SFRA test can be completed in a few hours.
11.2 Limitations
No test method is perfect, and the SFRA test has some limitations that engineers must be aware of.
The test requires a factory baseline for meaningful interpretation. Comparing a field measurement to another field measurement (without factory data) is less reliable, though inter-phase comparisons can still provide useful information.
SFRA cannot diagnose electrical faults in isolation. It provides information about mechanical and structural changes. Electrical faults such as insulation breakdown, moisture ingress, or turn-to-turn insulation degradation need to be diagnosed with complementary tests such as power factor (dissipation factor) testing, dissolved gas analysis (DGA), and winding resistance measurement.
Experienced interpretation is necessary. The FRA signature is a complex waveform. Interpreting deviations correctly requires knowledge of the transformer design, the test conditions, and the influence of non-fault variables such as temperature and tap position.
Environmental factors particularly electromagnetic interference from nearby high-voltage equipment can distort measurements if not controlled.
12. Complementary Tests to SFRA
The SFRA test of transformer is most effective when performed as part of a broader pre-commissioning test program. The following tests complement SFRA and together provide a complete condition assessment:
- Winding Resistance Measurement: Detects open circuits, high-resistance connections, and tap changer contact problems
- Transformer Turns Ratio (TTR) Test: Verifies the correct turns ratio and detects tap changer errors
- Power Factor / Dissipation Factor Test: Assesses the condition of the insulation system
- Dissolved Gas Analysis (DGA): Identifies thermal or electrical faults inside the oil-filled transformer
- Excitation Current Test: Detects core faults and shorted turns
- Short Circuit Impedance Measurement: Can detect winding deformation by comparing measured impedance to nameplate values
13. Conclusion
The Sweep Frequency Response Analysis (SFRA) test is one of the most reliable and informative diagnostic tools available to electrical engineers working with power transformers. It provides a detailed picture of the transformer’s internal mechanical condition without any dismantling or risk of damage to the equipment.
From the factory baseline to periodic maintenance checks throughout decades of service, the SFRA test of transformer forms the foundation of a strong condition monitoring program. Following the systematic SFRA test procedure outlined in this guide combined with the proper use of a calibrated SFRA test kit, correct SFRA test connections, and careful SFRA graph analysis per IEC 60076-18 and IEEE C57.149 gives engineers the confidence to make sound commissioning and maintenance decisions.
14. Frequently Asked Questions (FAQs)
The SFRA full form is Sweep Frequency Response Analysis. It is also referred to as Frequency Response Analysis (FRA). The two terms are often used interchangeably, though SFRA specifically refers to the swept sine wave measurement method.
The purpose of SFRA test in transformer diagnostics is to assess the mechanical integrity of the transformer’s windings and core. The test detects faults such as winding displacement, core movement, hoop buckling, and broken clamping structures.
The standard frequency range for sweep frequency response analysis is 20 Hz to 2 MHz. This range covers three diagnostic regions: the low-frequency region (20 Hz to 2 kHz) for core-related faults, the mid-frequency region (2 kHz to ~500 kHz) for winding deformation faults, and the high-frequency region (~500 kHz to 2 MHz) for turn-to-turn and fine winding faults.
The SFRA test kit injects a low-voltage swept sine wave signal between 1 and 10V RMS, into the transformer winding.
For a three-phase two-winding transformer, the standard SFRA test connections follow the end-to-end open circuit configuration. For the HV winding: H1 to H2, H2 to H3, and H1 to H3, with all other terminals floating. For the LV winding: X1 to X2, X2 to X3, and X1 to X3, with all other terminals floating.
The SFRA test primarily detects mechanical and structural changes inside the transformer. It is not a standalone test for electrical insulation faults.
The SFRA test procedure requires testing at three tap positions: maximum tap, nominal tap, and minimum tap.
If the SFRA graph analysis shows a significant deviation from the factory baseline confirmed by a low Correlation Coefficient in the relevant frequency region — the transformer should not be commissioned. The deviation must be investigated in detail.